Have you really tapped into the power of Google Analytics?
More than half of websites worldwide use Google Analytics to collect and analyze their traffic data, but how many of them actually make the most out of this tool?
If you feel like you could do more with Google Analytics, this post is for you. Here are 6 tips for improving your Google Analytics data analysis.
Save Your Time with Custom Alerts
Who likes to stare at a bunch of numbers on their screen?
Nobody, but in GA, you simply have to deal with numbers.
If you don’t have time to dig through your dashboard every time you want to extract specific data, you can set up custom alerts every time a specific goal is triggered. Basically, this feature allows you to receive an email every time there’s an event that you want to be notified about (like a sudden drop in organic visits, 404 page errors, etc.)
Choose the Right View
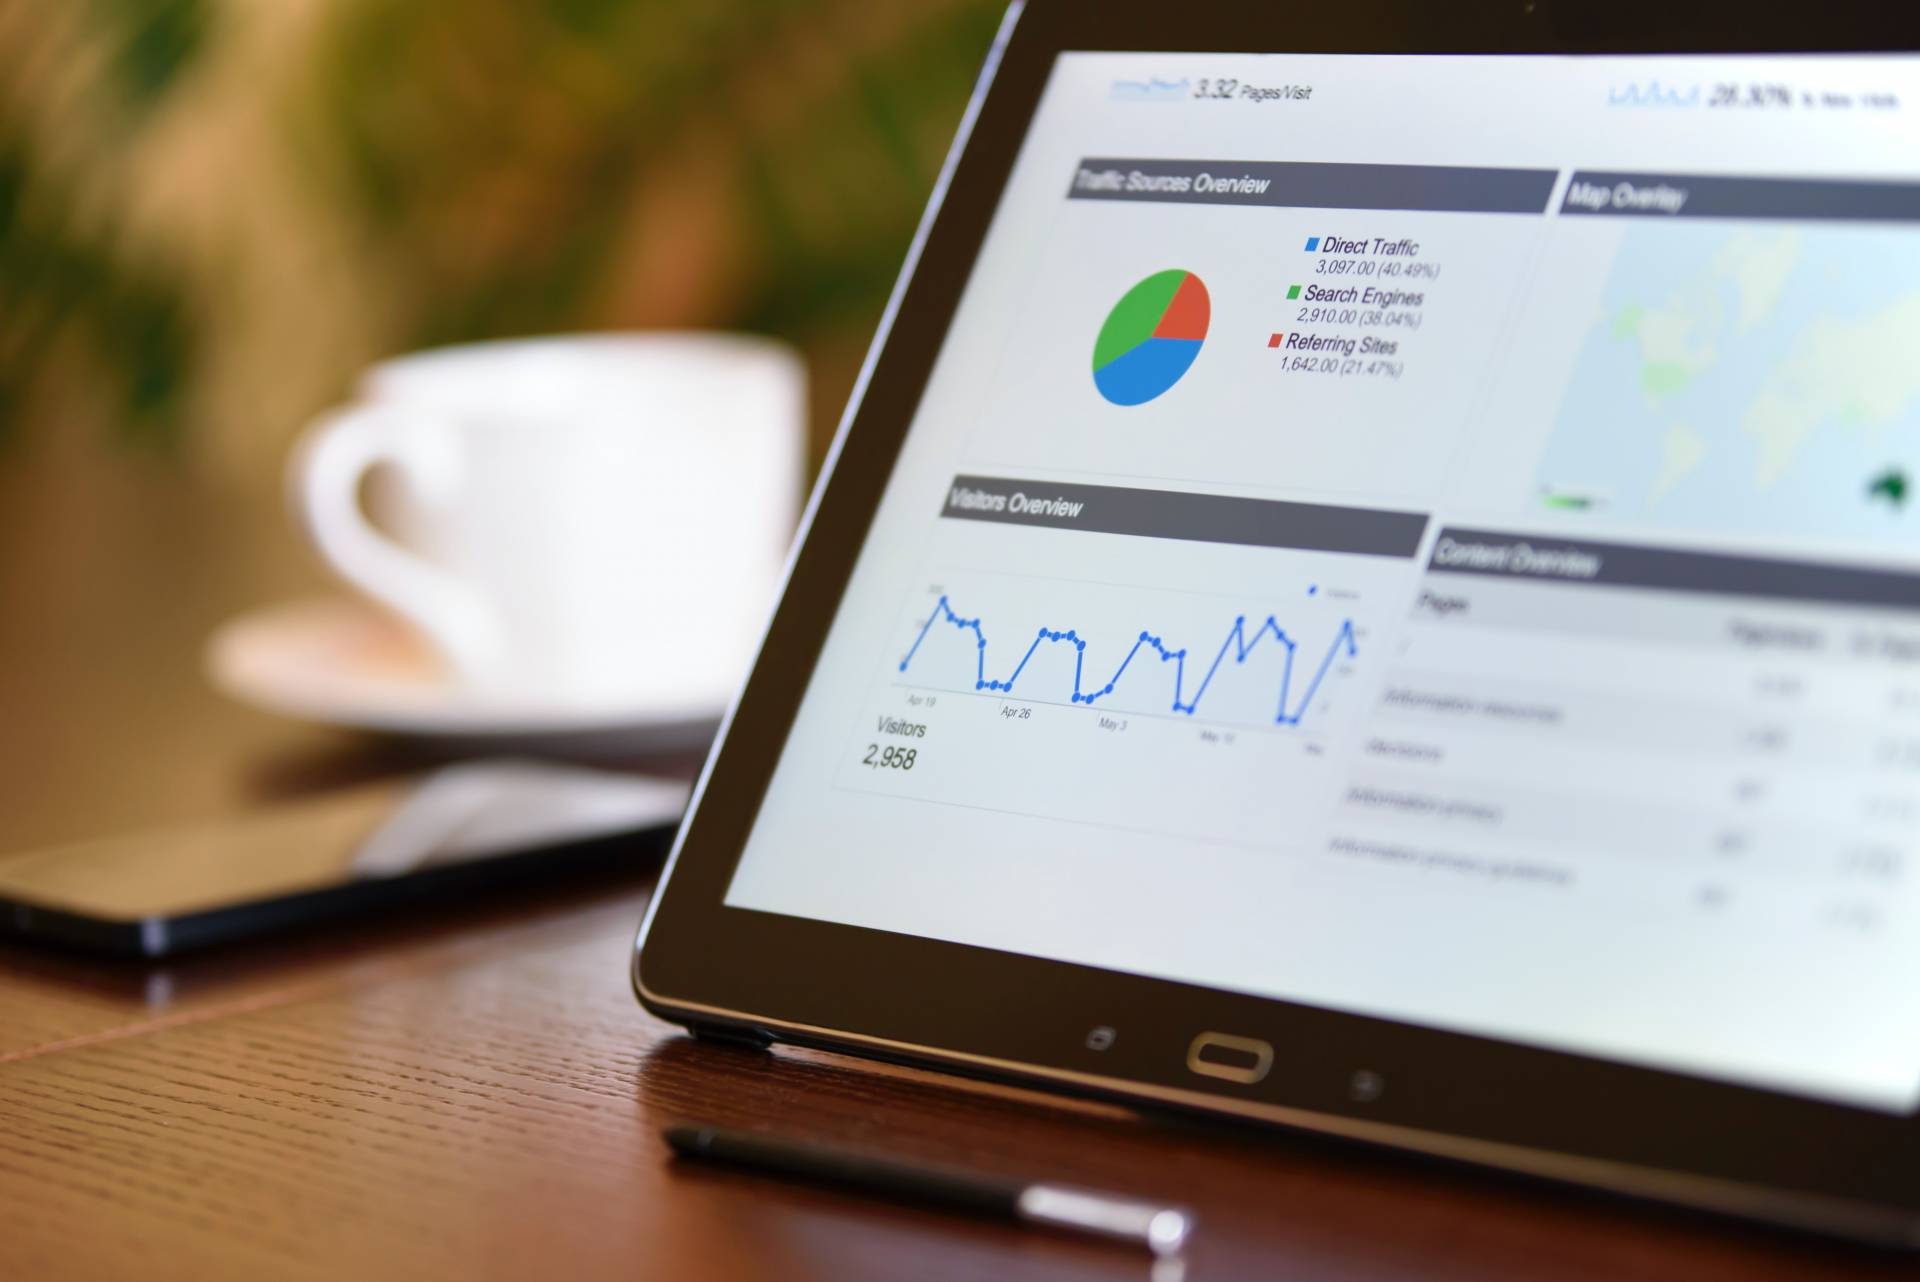
Certain Google Analytics metrics may be easier to analyze if displayed in different views. Luckily, GA offers tables, pie charts, and more, so you can pick what works for you at the moment. Some of the available views are:
- Tables (the default view with your data shown in a table)
- Pie charts (your data displayed in percentages)
- Horizontal charts (good for analyzing a metric’s performance over time)
- Comparison charts, and more
Include Site Search in Your Google Analytics Reports
You may know what pages your users have visited, but what exactly were they looking for?
If you remember to track site search too, that can provide you with lots of useful information about what your visitors need. If your website has a search bar, tracking site search is a must – because it’s a simple way to find out, for example, what topics you should write about more.
Set Goals
When you have a correctly configured goal with goal values, it’s easier to understand how the metrics you’re measuring affect your business. You can measure different types of goals in Google Analytics:
- Duration – how much time a user spent on a page
- Destination – what pages a user has loaded
- Pages per session – how many pages a user has loaded in one session
- Event – an action that a user has taken (video views, “Get Quotes” for comparison shopping, lead magnet download, etc.)
Segment Your Data
If you only track your traffic volume, you can’t learn where it comes from. You won’t be sure what adjustments you should make on your website or in your marketing strategy to improve your site’s performance.
By segmenting your data by different dimensions, devices, traffic sources, etc. you can identify opportunities for successful campaigns or fix any existing problems more easily.
Use Annotations
Have you ever gone back to a spike in user activity on your website, but you had no idea why it happened?
Yes, it’s easy to forget such things, especially if you have to deal with lots of data every day.
But the fix is simple: set up annotations and you’ll exactly know what happened next time you, for example, see a sudden spike in organic traffic.
Simple Steps for Excellent Results
Are you ready to apply these six tips to your data analysis?
If you use Google Analytics, make sure you uncover its full potential by exploring all your options. Simple steps like adding notes, changing the view, or setting goals can have a huge impact on how successfully you interpret your data.
And when you interpret your data accurately, you’ll be able to boost your website’s performance in no time.
About the author: Sara Routhier is an SEO manager with AutoInsurance.org. Her team uses Google Analytics to determine the pages they should target for backlinks.